Axis Multi Asset Allocation Fund

Returns:


Outlook
Loading PDF viewer...
How to start your investing journey on Axis Mutual Fund?


Invest Now
₹
+ 1000+ 500
SIP Debit Day
How to start your investing journey on Axis Mutual Fund?
Get Link


It is a 3-in-1 investment option or an asset allocation fund which helps you diversify your money across three asset categories - equity, debt and gold.

Facilitates investing in Gold, one of the most popular option amongst Indian investors and a good hedge against macro events.

Creates long-term wealth through exposure to equities and protects against market volatility through debt investments. Therefore, providing stability.

The fund rebalances your portfolio periodically by selling the asset which has outperformed, and buying the asset which has underperformed. This boosts the chances of increasing the average returns of investment.

Single application sufficient for investment in three asset classes.
The Scheme seeks to generate long term capital appreciation by investing in a diversified portfolio of equity and equity related instruments, debt and money market instruments, Exchange Traded Commodity Derivatives / Units of Gold ETFs, Silver ETF & units of REITs/InvITs. However, there can be no assurance or guarantee that the investment objective of the Scheme would be achieved.
| If redeemed/switch out within 12 months from the date of allotment | |
| For 10% of investment | Nil |
| For remaining investment | 1% |
| If redeemed/switch out after 12 months | |
| From the date of allotment | Nil |
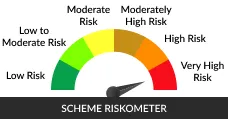
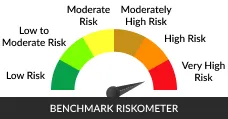

| Nifty 500 TRI Index (65%) + Nifty Composite Debt Index (20%) + Domestic Price of Physical Gold (7.5%) + Domestic Price of Physical Silver (7.5%) | Current Value of Rs.10,000 Invested | |||||
|---|---|---|---|---|---|---|
| Annualised(%) | 65% of Nifty 500 TRI + 20% of NIFTY Composite Debt Index + 7.5% of Domestic Price of Gold + 7.5% of Domestic Price of Silver Benchmark(%) | Nifty 50 TRI Additional Benchmark(%) | Annualised(₹) | 65% of Nifty 500 TRI + 20% of NIFTY Composite Debt Index + 7.5% of Domestic Price of Gold + 7.5% of Domestic Price of Silver Benchmark(₹) | Nifty 50 TRI Additional Benchmark(₹) | |
| Since Inception 2010-08-23 | 9.46% | - | 10.52% | 43,203 | - | 50,513 |
| 5 Years | 6.89% | - | 6.69% | 13,957 | - | 13,829 |
| 3 Years | 12.32% | 13.30% | 7.74% | 14,169 | 14,546 | 12,508 |
| 1 Year | 1.25% | -0.69% | -9.47% | 10,124 | 9,931 | 9,055 |
| SIP Investments | Total Amount Invested | Market Value (As on 2026-10-30) | Returns (Annualised) | Benchmark Returns (Annualised) | Additional Benchmark Returns (Annualised) | Benchmark Market Value | Additional Benchmark Market Value |
|---|---|---|---|---|---|---|---|
| Since Inception 01 Jan 2013 | 19,50,000 | 46,27,136.51 | 9.87% | - | 11.21% | - | 52,41,063.10 |
| 5 Years | 6,00,000 | 7,48,833.72 | 8.81% | - | 5.14% | - | 6,83,083.75 |
| 3 Years | 3,60,000 | 4,00,001.45 | 6.98% | 6.26% | -0.54% | 3,95,760.28 | 3,57,034.26 |
| 1 Year | 1,20,000 | 1,17,969.61 | -3.14% | -7.36% | -9.03% | 1,15,209.08 | 1,14,109.15 |

| Stocks | % of holdings |
|---|---|
| Axis Gold ETF | 11.16 |
| ICICI Bank Limited | 4.43 |
| HDFC Bank Limited | 3.15 |
| Axis Silver ETF | 2.69 |
| Axis Bank Limited | 2.59 |
| Record Date | Option | IDCW (Per Unit) | NAV (Per Unit) | ||
|---|---|---|---|---|---|
| Individuals/HUF | Others | Cum IDCW | Ex- IDCW | ||
| 2026-10-26 | Monthly Dividend | 0.15 | 0.15 | 18.39 | 18.24 |
| 2026-09-25 | Monthly Dividend | 0.15 | 0.15 | 18.96 | 18.81 |
| 2026-08-25 | Monthly Dividend | 0.15 | 0.15 | 20.07 | 19.92 |