Axis Equity Savings Fund

Returns:


Outlook
Loading PDF viewer...
How to start your investing journey on Axis Mutual Fund?


Invest Now
₹
+ 1000+ 500
SIP Debit Day
How to start your investing journey on Axis Mutual Fund?
Get Link


The fund follows a multi-asset strategy that helps investors avoid the trap of over investing in one asset class. Therefore reducing the overall risk and volatility.

This fund is ideal for people who want to have a balanced approach to portfolio management.

Given that the money is diversified across different asset classes, it reduces the impact of bad performance from a single asset class through performance from the other 2 asset classes.

Tax efficient.
The investment objective of the scheme is to provide capital appreciation and income distribution to the investors by using equity and equity related instruments, arbitrage opportunities, and investments in debt and money market instruments. However, there is no assurance or guarantee that the investment objective of the Scheme will be achieved. The Scheme does not assure or guarantee any returns.
| If redeemed/switch out within 1 month from the date of allotment | |
| For 10% of investment | Nil |
| For remaining investment | 1% |
| If redeemed/switch out after 1 month | |
| From the date of allotment | Nil |
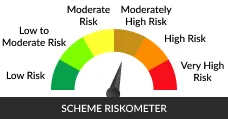
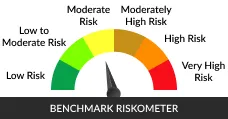

| NIFTY Equity Savings Index | Current Value of Rs.10,000 Invested | |||||
|---|---|---|---|---|---|---|
| Annualised(%) | NIFTY Equity Savings Index Benchmark(%) | NIFTY 10 yr Benchmark G-Sec Additional Benchmark(%) | Annualised(₹) | NIFTY Equity Savings Index Benchmark(₹) | NIFTY 10 yr Benchmark G-Sec Additional Benchmark(₹) | |
| Since Inception 2015-08-14 | 7.67% | 8.20% | 6.01% | 22,910 | 24,213 | 19,244 |
| 5 Years | 6.14% | 6.75% | 4.97% | 13,476 | 13,867 | 12,750 |
| 3 Years | 8.07% | 7.58% | 6.14% | 12,623 | 12,452 | 11,958 |
| 1 Year | 1.69% | 0.40% | -0.07% | 10,169 | 10,039 | 9,993 |
| SIP Investments | Total Amount Invested | Market Value (As on 2026-10-30) | Returns (Annualised) | Benchmark Returns (Annualised) | Additional Benchmark Returns (Annualised) | Benchmark Market Value | Additional Benchmark Market Value |
|---|---|---|---|---|---|---|---|
| Since Inception 14 Aug 2015 | 13,40,000 | 21,11,224.77 | 7.85% | 8.16% | 5.33% | 21,49,840.25 | 18,19,837.81 |
| 5 Years | 6,00,000 | 7,08,027.56 | 6.57% | 6.42% | 5.06% | 7,05,417.24 | 6,81,768.45 |
| 3 Years | 3,60,000 | 3,84,476.45 | 4.33% | 4.25% | 3.49% | 3,84,010.22 | 3,79,640.43 |
| 1 Year | 1,20,000 | 1,21,327.12 | 2.07% | 0.21% | -1% | 1,20,135.16 | 1,19,359.43 |

| Stocks | % of holdings |
|---|---|
| 7.18% GOI (MD 14/08/2033) | 4.66 |
| ICICI Bank Limited | 3.68 |
| Axis Money Market Fund - Direct Plan - Growth Option | 3.12 |
| Cholamandalam Investment and Finance Company Ltd | 2.94 |
| 7.1% GOI (MD 08/04/2034) | 2.43 |
| Record Date | Option | IDCW (Per Unit) | NAV (Per Unit) | ||
|---|---|---|---|---|---|
| Individuals/HUF | Others | Cum IDCW | Ex- IDCW | ||
| 2026-10-26 | Monthly Dividend | N/A | N/A | N/A | N/A |
| 2026-09-25 | Monthly Dividend | N/A | N/A | N/A | N/A |
| 2026-08-25 | Monthly Dividend | 0.07 | 0.07 | 11.22 | 11.15 |
| 2026-09-25 | Quarterly Dividend | 0.27 | 0.27 | 11.54 | 11.27 |
| 2026-06-25 | Quarterly Dividend | 0.27 | 0.27 | 11.79 | 11.52 |
| 2026-03-25 | Quarterly Dividend | 0.27 | 0.27 | 11.58 | 11.31 |
| 2026-03-17 | Dividend | 1.03 | 1.03 | 12.78 | 11.75 |
| 2025-03-11 | Dividend | 1.08 | 1.08 | 13.12 | 12.04 |
| 2024-02-08 | Dividend | 1.15 | 1.15 | 13.57 | 12.42 |