Axis Conservative Hybrid Fund

Returns:


Outlook
Loading PDF viewer...
How to start your investing journey on Axis Mutual Fund?


Invest Now
₹
+ 1000+ 500
SIP Debit Day
How to start your investing journey on Axis Mutual Fund?
Get Link


A moderately high risk fund suitable for an investment horizon of more than 2 years.

Brings stability to your portfolio by investing primarily in fixed income instruments.

Offers the potential for capital growth through limited exposure to equity instruments.
The scheme seeks to generate regular income through investments in debt & money market instruments, along with capital appreciation through limited exposure to equity and equity related instruments. It also aims to manage risk thorough active asset allocation.
| If redeemed/switch out within 1 month from the date of allotment | |
| For 10% of investment | Nil |
| For remaining investment | 1% |
| If redeemed/switch out after 1 month | |
| From the date of allotment | Nil |
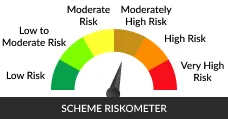
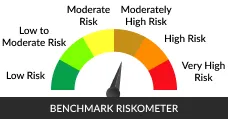

| NIFTY 50 Hybrid Composite Debt 15:85 Index | Current Value of Rs.10,000 Invested | |||||
|---|---|---|---|---|---|---|
| Annualised(%) | NIFTY 50 Hybrid Composite Debt 15:85 Index Benchmark(%) | NIFTY 10 yr Benchmark G-Sec Additional Benchmark(%) | Annualised(₹) | NIFTY 50 Hybrid Composite Debt 15:85 Index Benchmark(₹) | NIFTY 10 yr Benchmark G-Sec Additional Benchmark(₹) | |
| Since Inception 2010-07-16 | 6.97% | 7.91% | 6.16% | 29,996 | 34,608 | 26,481 |
| 5 Years | 4.32% | 5.34% | 4.97% | 12,357 | 12,972 | 12,750 |
| 3 Years | 5.25% | 5.75% | 6.14% | 11,658 | 11,828 | 11,958 |
| 1 Year | -1.14% | -1.44% | -0.07% | 9,886 | 9,856 | 9,993 |
| SIP Investments | Total Amount Invested | Market Value (As on 2026-10-30) | Returns (Annualised) | Benchmark Returns (Annualised) | Additional Benchmark Returns (Annualised) | Benchmark Market Value | Additional Benchmark Market Value |
|---|---|---|---|---|---|---|---|
| Since Inception 01 Jan 2013 | 19,60,000 | 34,39,295.87 | 6.52% | 7.63% | 5.95% | 38,04,596.62 | 32,67,606.89 |
| 5 Years | 6,00,000 | 6,65,157.92 | 4.08% | 4.74% | 5.06% | 6,76,340.54 | 6,81,836.29 |
| 3 Years | 3,60,000 | 3,73,061.63 | 2.33% | 2.56% | 3.50% | 3,74,366.56 | 3,79,708.26 |
| 1 Year | 1,20,000 | 1,18,846.94 | -1.79% | -2.20% | -1% | 1,18,578.45 | 1,19,359.43 |

| Stocks | % of holdings |
|---|---|
| 7.18% GOI (MD 14/08/2033) | 15.78 |
| 6.94% GOI (MD 11/05/2036) | 13.64 |
| 6.79% GOI (MD 07/10/2034) | 11.75 |
| Power Finance Corporation Limited | 6.84 |
| 7.18% GOI (MD 24/07/2037) | 4.15 |
| Record Date | Option | IDCW (Per Unit) | NAV (Per Unit) | ||
|---|---|---|---|---|---|
| Individuals/HUF | Others | Cum IDCW | Ex- IDCW | ||
| 2026-03-25 | Annual Dividend | 0.5 | 0.5 | 13.87 | 13.37 |
| 2025-03-25 | Annual Dividend | 0.5 | 0.5 | 14.1 | 13.6 |
| 2024-03-26 | Annual Dividend | 0.5 | 0.5 | 13.54 | 13.04 |
| 2026-09-25 | Half Yearly Dividend | 0.2 | 0.2 | 12.57 | 12.37 |
| 2026-03-25 | Half Yearly Dividend | 0.25 | 0.25 | 12.68 | 12.43 |
| 2025-09-25 | Half Yearly Dividend | 0.25 | 0.25 | 13.03 | 12.78 |
| 2026-09-25 | Quarterly Dividend | 0.1 | 0.1 | 10.25 | 10.15 |
| 2026-06-25 | Quarterly Dividend | 0.1 | 0.1 | 10.47 | 10.37 |
| 2026-03-25 | Quarterly Dividend | 0.2 | 0.2 | 10.43 | 10.23 |