Low-Volatility Index vs Nifty 500 Index: What Is the Difference?


Investing in equities can help investors participate in the long-term growth of companies. But markets do not always move in a straight line. There may be periods when prices rise quickly and periods when they fall sharply.
These ups and downs can make investors uncomfortable. Some investors may even exit their investments during a market fall and miss the recovery that follows.
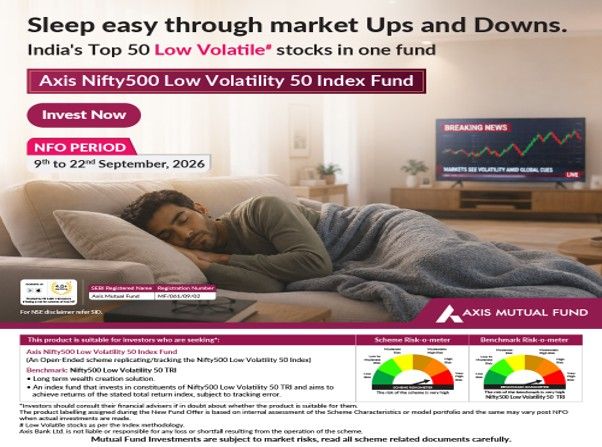
Low-volatility investing offers a different way to participate in equities. It focuses on stocks that have historically shown relatively fewer price fluctuations.
The Nifty500 Low Volatility 50 follows this approach. It selects 50 stocks from the broader Nifty 500 universe based on their Low Volatility Scores.
Same Destination, Different Journey
Consider two cars travelling to the same destination.
The first car accelerates quickly, brakes suddenly and offers a bumpy ride. The second car moves at a more consistent speed and offers a relatively smoother journey.
Both cars are heading towards the same destination. However, the experience of travelling in them can be different.
Low-volatility investing works on a similar idea. It does not try to find the fastest-moving stocks every day. Instead, it focuses on stocks whose prices have historically moved relatively less compared with other stocks.
In simple terms, the strategy aims to make the equity investment journey relatively smoother, not slower.
What Is the Nifty 500 Index?
The Nifty 500 is a broad index representing 500 companies from the Indian equity market. It includes companies from different sectors and market-cap segments. This gives investors broad exposure to a variety of businesses through one index. The Nifty 500 also acts as the starting universe for the Nifty500 Low Volatility 50 Index. This means that the Low Volatility Index selects its stocks from companies that are already part of the Nifty 500.^1
Therefore, these are not two completely different investment universes.
Think of the Nifty 500 as a large basket of 500 companies. The Nifty500 Low Volatility 50 Index applies a defined filter to this basket and selects 50 stocks that have shown relatively lower price fluctuations.How Are the 50 Stocks Selected?
The process begins with the companies in the Nifty 500 Index. Companies are first checked against defined eligibility and liquidity conditions. The eligible stocks are then given a Low Volatility Score based on their price movements over the previous one year.^1
From this list, 50 stocks with the required Low Volatility Scores are selected.
The weight of each stock in the index is based on two factors:
• Its Low Volatility Score
• Its free-float market capitalisation
Free-float market capitalisation refers to the value of a company’s shares that are available for public trading.
The index is reviewed twice a year, in June and December. This helps the portfolio continue to reflect eligible stocks with relatively favourable Low Volatility Scores.^1
Why Can a Smoother Journey Matter?
Investing may feel easy when markets are rising. The real test often comes when markets correct.
Large market movements can make investors anxious. A relatively smoother journey may help investors remain focused on their long-term goals instead of reacting to short-term market movements.
Historical data shows how the Nifty500 Low Volatility 50 TRI behaved during selected periods of market correction.
During the Global Financial Crisis from January 8, 2008 to October 27, 2008:
• The Nifty500 Low Volatility 50 TRI declined by 47.3%
• The Nifty 500 TRI declined by 63.4% ^2
During the COVID-19 market correction from February 19, 2020 to March 23, 2020:
• The Nifty500 Low Volatility 50 TRI declined by 28.8%
• The Nifty 500 TRI declined by 37.2% ^2
A similar pattern was observed during two other periods:
• During the Taper Tantrum, the Low Volatility Index declined by 4.6%, compared with 11.9% for the Nifty 500 TRI.
• During the Yuan devaluation period, it declined by 14.1%, compared with 17.9% for the Nifty 500 TRI.^2
These examples show that the Low Volatility Index experienced smaller declines than the Nifty 500 TRI during the selected periods. Past market behaviour, however, may not be repeated in the future.
A Smoother Ride Did Not Mean Slower Growth
Low volatility may sound like a slower investment strategy. However, the historical index data presents a different picture.
As of July 31, 2026, the Nifty500 Low Volatility 50 TRI recorded:
• A five-year CAGR of 15.0%, compared with 12.5% for the Nifty 500 TRI
• A 10-year CAGR of 15.1%, compared with 13.6% for the Nifty 500 TRI
• A 15-year CAGR of 15.1%, compared with 13.0% for the Nifty 500 TRI
• A 20-year CAGR of 16.0%, compared with 13.0% for the Nifty 500 TRI^3
CAGR stands for Compounded Annual Growth Rate. In simple words, it shows the average yearly growth of an investment over a given period.
The Low Volatility Index also recorded relatively lower annualised volatility over these periods. For example, its 10-year annualised volatility was 13.6%, compared with 16.2% for the Nifty 500 TRI. Over 20 years, the figures were 15.6% and 19.9%, respectively.^3
Therefore, the historical data shows that the strategy delivered differentiated long-term returns while experiencing relatively lower price fluctuations over the periods considered.
What Could ₹1 Lakh Have Become?
Here is a simple long-term illustration.
An investment of ₹1 lakh in the Nifty500 Low Volatility 50 Index in March 2005 would have grown to approximately ₹31.33 lakh by July 2026.^4 During this period, the Nifty500 Low Volatility 50 TRI recorded a CAGR of 17.5%, compared with 14.2% for the Nifty 500 TRI.^4 This is index-level data and does not represent the actual performance of the Axis Nifty500 Low Volatility 50 Index Fund. Index calculations do not include costs, scheme expenses, tracking difference or tracking error.
Performance Across Different Starting Points
Investment returns can change depending on when an investor enters the market. Rolling returns look at several different starting points instead of considering only one start and end date.
From March 31, 2005 to July 31, 2026, the Nifty500 Low Volatility 50 TRI recorded average rolling returns of:
• 19.2% over one year, compared with 16.7% for the Nifty 500 TRI
• 16.5% over three years, compared with 13.2% for the Nifty 500 TRI
• 16.3% over five years, compared with 13.2% for the Nifty 500 TRI^5
These historical figures offer another way to understand how the strategy performed across different investment periods.
The Broad Market, with a Low-Volatility Filter
The Nifty 500 offers broad participation across 500 Indian companies. The Nifty500 Low Volatility 50 Index starts with this broad and diversified universe and adds a Low Volatility Score-based selection process.
The result is a portfolio of 50 stocks that offers:
• Selection from the broad Nifty 500 universe
• Exposure across multiple companies and sectors
• A clear, rule-based investment approach
• Focus on stocks with relatively lower historical price fluctuations
• A stability-oriented approach to equity participation
The Axis Nifty500 Low Volatility 50 Index Fund will seek to replicate or track the Nifty500 Low Volatility 50 TRI, subject to tracking error.
For investors who want to participate in the equity market while placing greater emphasis on the journey, it offers a simple proposition: the broad opportunities of the Nifty 500 universe, accessed through a more stability-oriented route.
Sources and Disclaimers
1. Source: NSE Indices Limited. Index methodology and data as of July 31, 2026. Low volatility is calculated as the inverse of standard deviation based on the previous one-year price returns. The index is rebalanced semi-annually.
2. Source: NSE Indices Limited. Data as of July 31, 2026. The selected periods are the Global Financial Crisis from January 8, 2008 to October 27, 2008; Taper Tantrum from January 1, 2013 to August 30, 2013; Yuan devaluation from August 3, 2015 to February 29, 2016; and COVID-19 correction from February 19, 2020 to March 23, 2020.
3. Source: NSE Indices Limited. Data as of July 31, 2026. Performance pertains to Total Return Indices. Index returns do not include costs, scheme expenses, tracking difference or tracking error.
4. Source: NSE Indices Limited. Data as of July 31, 2026. Performance is calculated using Total Return Index (TRI), with zero cost / expenses and tracking difference / error. Source :Nifty indices. Date : 31-Jul-2026;
5. Source: NSE Indices Limited. Data period: March 31, 2005 to July 31, 2026. Rolling returns are based on multiple observations during the stated period.
Past performance may or may not be sustained in the future. The above information should not be construed as promise, guarantee or forecast of returns.
For complete index performance refer:
https://www.axismf.com/1/5/85/93/4610/4612/One_Pager_Axis_Nifty500_Low_Volatality_50_6738961976.pdf
https://www.niftyindices.com/indices/equity/strategy-indices/nifty500-low--volatility-50
Mutual fund investments are subject to market risks, read all scheme related documents carefully
Calculator
View All