Nifty Energy vs Nifty 500: A 25-Year Return and Drawdown Comparison


Axis Nifty Energy Index Fund NFO | 7th – 21st August 2026
When investors compare a focused sector index like the Nifty Energy TRI against a broad-market benchmark like the Nifty 500 TRI , the goal is simple: understand how much extra growth potential a thematic strategy can add, and how it behaves across market cycles. Over the last 25 years, India's energy sector has told a powerful wealth-creation story- one that the Axis Nifty Energy Index Fund now makes accessible to every investor from just ₹100.
This article breaks down the Nifty Energy vs Nifty 500 return comparison, examines drawdown behaviour, and explains what it means for your long-term portfolio.
What is the difference between the Nifty Energy Index and the Nifty 500 Index?
The Nifty 500 Index is a broad-market, diversified benchmark representing the top 500 companies across every sector of the Indian economy. The Nifty Energy Index, by contrast, is a focused thematic index of up to 40 companies spanning India's complete energy value chain- oil & gas, power generation, coal, transmission and renewable energy.^
In short: the Nifty 500 spreads exposure across all sectors, while the Nifty Energy Index concentrates conviction on the one theme India cannot grow without- energy. This focus is precisely what has powered its long-term outperformance.
How has the Nifty Energy TRI performed vs the Nifty 500 TRI?
Across virtually every meaningful time horizon, the Nifty Energy TRI has stayed ahead of the broader Nifty 500 TRI. Here's the annualised returns (CAGR) comparison as of 30 June 2026:ii
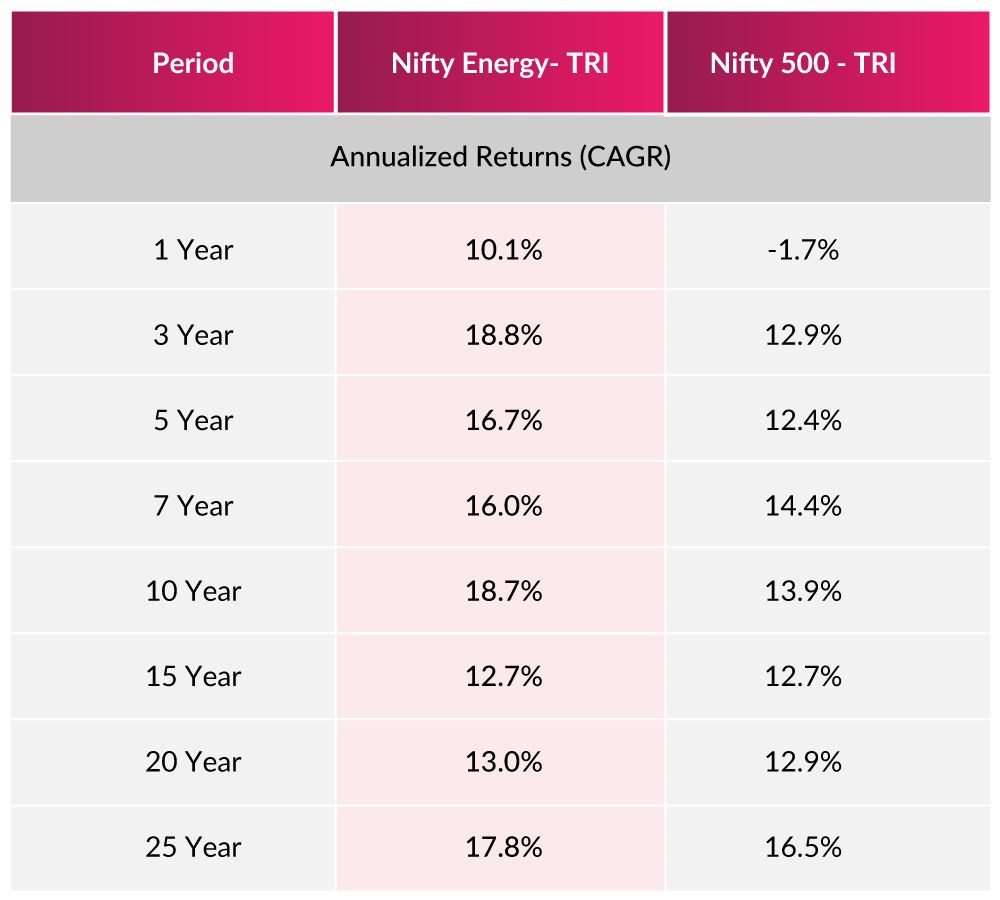
The standout takeaway: over the 1, 3, 5, 7, 10, and 25 -year periods, the Nifty Energy TRI has delivered a meaningful return premium over the diversified Nifty 500 TRI- with the sharpest edge visible in the most recent 1-year and 3-year windows.ii Past performance may or may not be sustained in the future.
What does the 25-year wealth-creation journey look like?
The long-term picture is where the energy story truly shines. A ₹1 lakh lumpsum investment in the Nifty Energy TRI nearly 25 years ago (from 29-Dec-2000) would have grown to approximately ₹70 lakh by June 2026- a remarkable 70x wealth-creation journey at an 18.1% CAGR.* Past performance may or may not be sustained in the future.
The SIP Story: Nifty Energy TRI
For systematic investors, the story is equally compelling: a monthly SIP of ₹10,000 in the Nifty Energy TRI over 20 years would have accumulated to approximately ₹1.08 crore- proof of how disciplined, long-term investing can harness India's energy megatrend.iii Past performance may or may not be sustained in the future.
What is a drawdown, and why does it matter?
A drawdown measures the peak-to-trough decline an index experiences during a downturn- essentially, how much it falls from its highest point before recovering. It's a key metric for understanding an investment's risk and resilience.
Because the Nifty Energy Index is a focused sector index, it can experience sharper swings than a fully diversified index like the Nifty 500 during specific market phases. But what matters most for long-term investors is not the temporary dip- it's the recovery and the compounding that follows. And here, India's energy sector has a proven history of resilience.
How has the Nifty Energy Index handled drawdowns across market cycles?
India's energy sector has navigated multiple major market cycles with remarkable resilience- from the Dot-Com bust and the 2008 Global Financial Crisis to the COVID-led market disruption. Through each of these events, the sector recovered and went on to create substantial long-term wealth, as the 70x, ~ 25-year journey demonstrates.*
Two structural features help the index manage drawdowns intelligently:
• Diversified value chain: Oil is only one part of the index. Power utilities, transmission companies, gas distribution and electrical-equipment makers each have independent demand drivers, giving the portfolio a natural, built-in cushion when any single fuel cycle softens.^
• Large-cap-led stability: The index is 72% large-cap, with 23% mid-cap and 6% small-cap exposure- anchoring it with established sector leaders while still capturing higher-growth opportunities.^
For long-term investors, drawdowns in a high-conviction sector are best viewed as opportunities to accumulate, especially through SIPs that benefit from rupee-cost averaging during dips.
Why has the Nifty Energy Index outperformed the broad market?
The outperformance isn't accidental- it's rooted in India's structural energy story:
• Rising demand: India's per-capita energy consumption is still just 1/3rd of the world average and 1/9th of the USA, giving demand a multi-decade runway.1
• Massive build-out: India is projected to add nearly 580 GW of new power capacity over the next decade- more than it has added in its entire history.5
• Complete value chain: Exposure across oil & gas, power, coal, transmission, renewables and heavy electrical equipment captures every part of the growth.^
Every unit of India's GDP growth needs energy behind it- and as the economy moves from USD 4 trillion toward USD 10 trillion, the energy sector sits at the very heart of that expansion.2
Nifty Energy or Nifty 500: which is right for your portfolio?
These two indices serve complementary roles, not competing ones. A Nifty 500 index fund is an excellent diversified core for any portfolio. The Axis Nifty Energy Index Fund is a high-conviction satellite that adds focused exposure to one of India's most powerful structural themes.
The smartest approach for most investors is to combine both- build a diversified core with a broad-market fund, then add a focused energy allocation to potentially enhance long-term growth, ideally with a 5–7 year-plus horizon and SIP discipline to smooth out sector volatility.
Why invest through the Axis Nifty Energy Index Fund NFO?
• One fund, complete energy engine- diversified across oil & gas, power, coal, transmission, renewables and equipment.^
• Low-cost, rules-based passive investing- transparent index tracking, no stock-picking.
• Accessible entry- start with just ₹100 (lumpsum or SIP), in multiples of ₹1 thereafter.
• Backed by Axis AMC- ₹3.5 lakh crore+ AUM, 1 crore+ investor accounts, and 39 passive investment solutions.iv
Invest in the Axis Nifty Energy Index Fund NFO between 7th and 21st August 2026 via the Axis Mutual Fund website or app.
Disclaimers:
^Source: Nifty Indices, Data as of 30-Jun-2026. Past performance may or may not be sustained in the future. Table / Charts mentioned above are used to explain the concept and is for illustration purpose only. The Stocks/Sectors mentioned herein are for general assessment purpose only and not a complete disclosure of every material fact. It should not be construed as investment advice to any party. https://www.niftyindices.com/indices/equity/thematic-indices/nifty-energy
ii Source: Nifty Indices, Data as of 30-Jun-2026. Past performance may or may not be sustained in the future. The above information should not be construed as promise, guarantee or forecast of returns. Table / Charts mentioned above are used to explain the concept and is for illustration purpose only. The Stocks mentioned herein are for general assessment purpose only and not a complete disclosure of every material fact. It should not be construed as investment advice to any party. Nifty 500 Index Rebased to 1000 as of 29-Dec-2000.https://www.niftyindices.com/indices/equity/thematic-indices/nifty-energy
*Source: Nifty Indices, Data as of 30-Jun-2026. Past performance may or may not be sustained in the future. The above information should not be construed as promise, guarantee or forecast of returns. Table / Charts mentioned above are used to explain the concept and is for illustration purpose only. *Rs.1 lakh investment start date considered as 29-12-2000.https://www.niftyindices.com/indices/equity/thematic-indices/nifty-energy
iii Note : For SIP returns, monthly investment of INR 10,000 invested on the first business day of every month has been considered. Performance is calculated using Total Return Index (TRI), with zero cost / expenses and tracking difference / error into consideration. Past Performance may or may not be sustained in future. Data as of 30-Jun-2026. Past performance may or may not be sustained in the future. The above information should not be construed as promise, guarantee or forecast of returns. Table / Charts mentioned above are used to explain the concept and is for illustration purpose only. .https://www.niftyindices.com/indices/equity/thematic-indices/nifty-energy
1https://en.wikipedia.org/wiki/List_of_countries_by_electricity_consumption Data : Year - 2025
5https://static.pib.gov.in/WriteReadData/specificdocs/documents/2025/jun/doc2025622575501.pdf; https://cea.nic.in/wp-content/uploads/notification/2026/03/Generation_Adequacy_Plan_2035_36.pdf; https://www.pib.gov.in/PressNoteDetails.aspx?id=155063&NoteId=155063&ModuleId=3®=48&lang=2
2Data downloaded as of July 2026; Energy Production and Consumption
iv Past performance may or may not be sustained in the future. The above information should not be construed as promise, guarantee or forecast of returns. Table / Charts mentioned above are used to explain the concept and is for illustration purpose only. Date : 30-Apr-2026. https://www.axismf.com/cms/sites/default/files/Statutory/Q4.pdf.
Click here to see schemewise: AUM https://www.axismf.com/1/5/464/4333/Scheme_AUM_Geography.pdf
This article has been issued on the basis of internal data, publicly available information and other sources believed to be reliable. The information contained in this document is for general purposes only and not a complete disclosure of every material fact. The Stocks mentioned herein is for explaining the concept and shall not be construed as an investment advice to any party. The information / data herein alone is not sufficient and shouldn’t be used for the development or implementation of an investment strategy. It should not be construed as investment advice to any party. All opinions, figures, estimates and data included in this article are as on date. The article does not warrant the completeness or accuracy of the information and disclaims all liabilities, losses and damages arising out of the use of this information. Axis MF/AMC is not guaranteeing/assuring any returns on investments.The statements contained herein may include statements of future expectations and other forward-looking statements that are based on our current views and assumptions and involve known and unknown risks and uncertainties that could cause actual results, performance or events to differ materially from those expressed or implied in such statements.
Readers shall be fully responsible/liable for any decision taken on the basis of this article. Mutual Fund investments are subject to market risks, read all scheme related documents carefully.
For NSE disclaimer refer SID.

Mutual Fund Investments are subject to market risks, read all scheme related documents carefully.
Calculator
View All