India’s Financialisation of Savings: The ₹300 Trillion MF Opportunity by 2035


India’s wealth story is changing fast. This isn’t a market phase — it’s a whole new way India is choosing to grow money. For decades, people trusted physical assets for security. But today, the shift is clear.As per AMFI, India’s mutual fund industry has grown at a 22% CAGR since 2016, now managing a massive ₹76.81 lakh crore.This isn’t a lucky bull run. It’s a complete reset in how Indians save, invest, and build long‐term wealth.[1]
The Great Shift: From Physical Lockers to Digital Portfolios
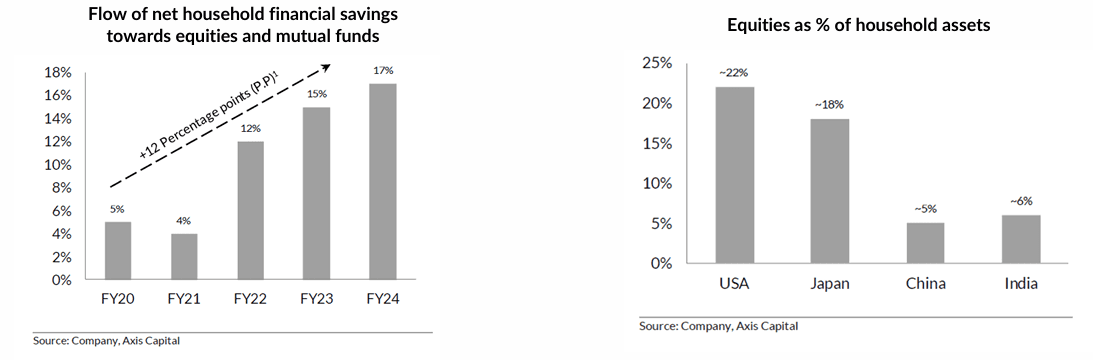
In the past, real estate and tangible gold were the main sources of savings for Indian households. Flow of new household financial saving tripled over last 5 years
- Key drivers includes - ease of transaction, superior liquidity, well regulated market, lesser transaction costs and higher return potential (and low real interest rate).
- Very low ratio of equity as % of household asset indicates continued growth opportunity.
Source: Axis Capital Research Report, April 2026 (Behind the Trades). Table / Charts mentioned above are used to explain the concept and is for illustration purpose only
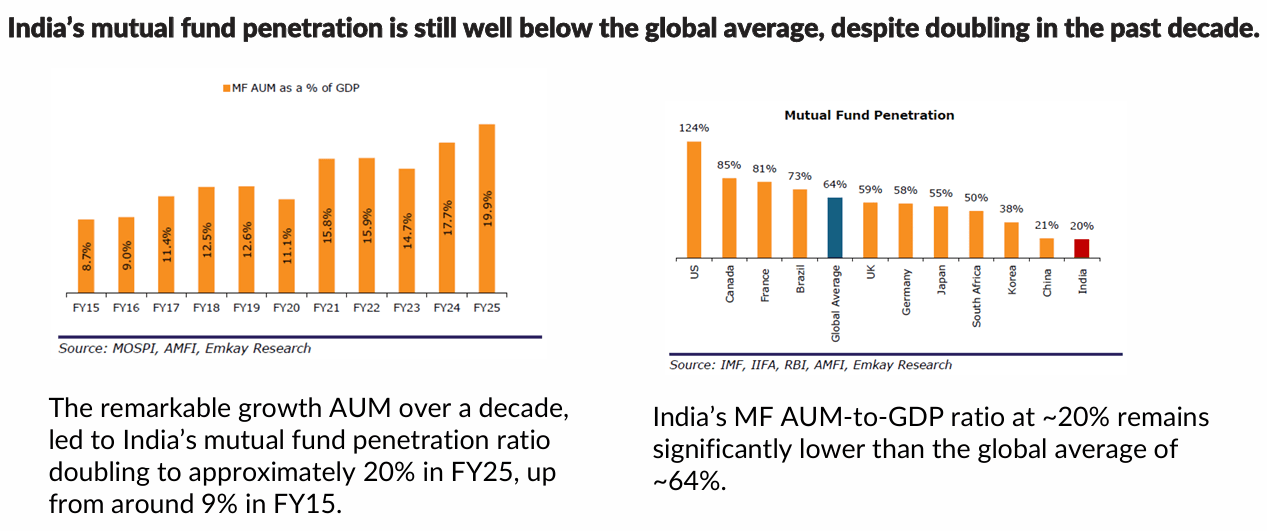
The Long Runway: Understanding the Under-Penetration
Under Penetration offers white space for growth.
Source: Emkay Research Report BFSI – Capital Markets, as of 13 April 2026. Table / Charts mentioned above are used to explain the concept and is for illustration purpose only
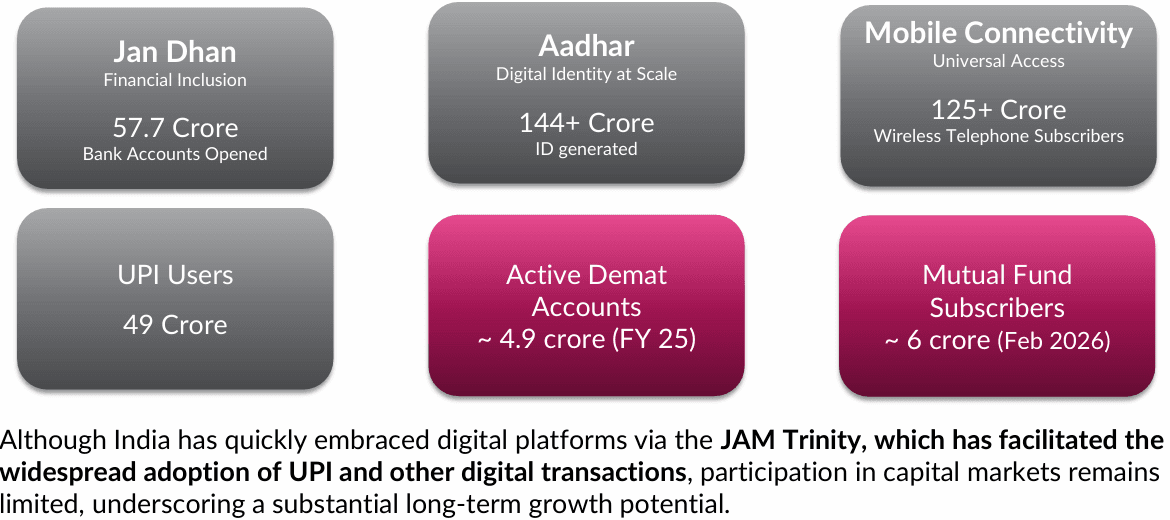
The Digital Engine: How the JAM Trinity Unlocked Scale
The 'Bharat' Volume Game: B30 Growth
While metropolitan areas drive high-value Average Ticket Sizes (ATS), the true volume engine of this financialisation story lies in the B30 (Beyond Top 30) cities.
According to AMFI's geographical data, the AUM from B30 locations stood at a modest ₹5 Lakh Crore in 2019. Fast forward to 2025, and that figure has surged past ₹17 Lakh Crore [7]. This is the result of vernacular-first communication strategies, intuitive mobile applications, and the psychological shift away from traditional chit funds and unorganized lending. By lowering the entry barrier to micro-SIPs and speaking to investors in their native languages, the industry has successfully tapped into the rural and semi-urban middle class.
Profiting from the Pickaxes: The Infrastructure Beneficiaries
During a gold rush, the potential way to build wealth is to sell pickaxes and shovels. In the context of India's financialisation, the pickaxes are the companies that run the market infrastructure.
As millions of new investors enter the markets, the companies running the system — AMCs, RTAs, wealth platforms, and stock exchanges — are seeing rapid growth because their revenues rise with AUM and trading activity.
Most of these players fall into the mid‐cap category: focused, scalable, and built with strong moats.For investors who want exposure to this trend, a capital market index fund offers direct access to these businesses. But since these companies move with market momentum, such funds tend to be high‐beta and volatile — best used as a satellite allocation, not the core of a portfolio.
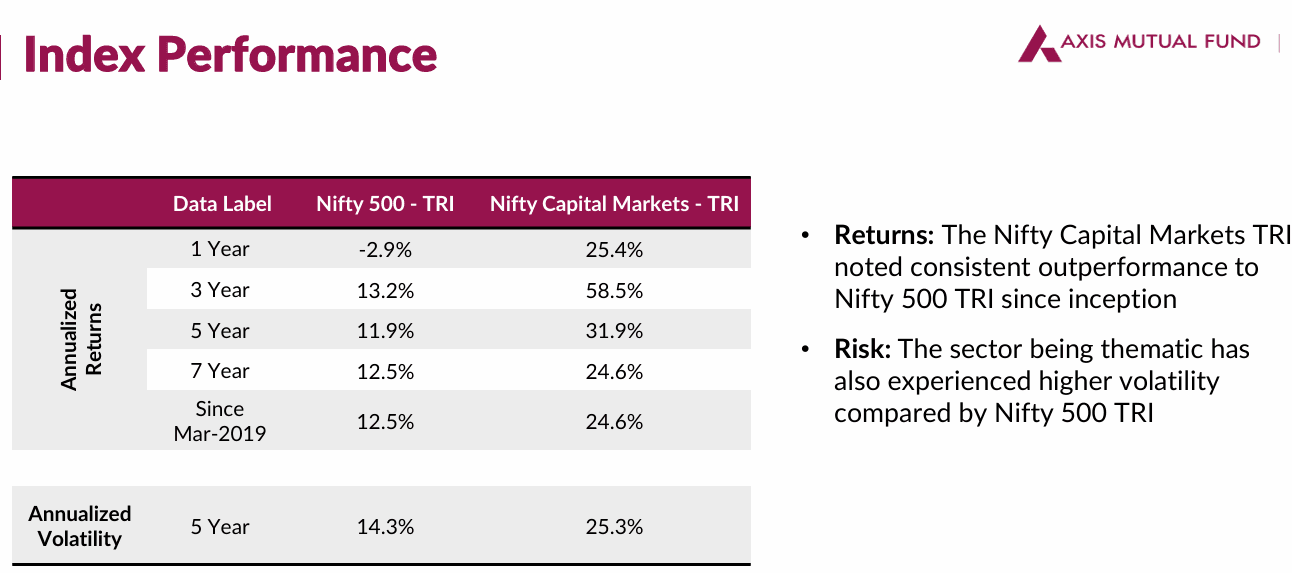
Performance View: The Financial Infrastructure Theme

The ₹300 Trillion Horizon
According to institutional frameworks and domestic analysts, India's mutual fund assets under management (AUM) might reach an astounding ₹300 trillion by 2035 (based on estimations consistent with IMF GDP growth estimates and prominent brokerage reports, such as Jefferies). [8].
Achieving this 4x multiple over the next decade requires sustained corporate earnings growth, political stability, and rising per capita income. But the mathematical foundation is already firmly in place. With over ₹20,000 Crore flowing into the markets every single month strictly through retail SIPs (AMFI Monthly Data) [9], domestic liquidity now acts as a massive shock absorber against foreign institutional outflows.
India's financialisation of savings is the most predictable, structurally sound economic mega-trend of our generation.
Ready to align your portfolio with India’s growth engine? Whether you are seeking advanced thematic exposure to market infrastructure or looking to start your first digital SIP, the time to upgrade your investment strategy is now. Speak with a certified financial distributor to explore funds that match your specific risk profile and time horizon.
Sources & Data References
1. Mutual Fund AUM & CAGR (₹76.81 Lakh Crore): Association of Mutual Funds in India (AMFI) – Monthly Industry Data & Historic AUM Reports. (Navigate to the latest month's 'Average AUM' PDF). Link: https://www.amfiindia.com/research-information/aum-data
2. India AUM-to-GDP Ratio (~20%): Validated via the AMFI-CRISIL Factbook 2024 (PDF), which tracks the direct correlation between India's market AUM and Gross Domestic Product. Link: https://www.amfiindia.com/Themes/Theme1/downloads/AMFIFactbook%202024.pdf
3.Global AUM-to-GDP Ratio (64%): Investment Company Institute (ICI) – Annual Global Factbook (PDF). (Refer to the Global Data section detailing worldwide regulated open-end funds vs global GDP). Link: https://www.ici.org/system/files/2023-05/2023-factbook.pdf
4. Jan Dhan Accounts (57.7 Crore): Ministry of Finance – Pradhan Mantri Jan Dhan Yojana (PMJDY) National Progress Report Dashboard. (Real-time, direct government tracker for active beneficiary accounts). Link: https://pmjdy.gov.in/account
5. Aadhaar Enrolments (144+ Crore): Unique Identification Authority of India (UIDAI) – Live Aadhaar Generation Dashboard. Link: https://uidai.gov.in/en/about-uidai/uidai-dashboard.html
6. UPI Active Users & Volume (49 Crore+): National Payments Corporation of India (NPCI) – UPI Product Statistics & Volume Tracker. Link: https://www.npci.org.in/what-we-do/upi/product-statistics
7. B30 AUM Growth & SIP Inflows: Association of Mutual Funds in India (AMFI) – Geographic & SIP Contribution Data Sheets. (Select the 'Age and Gender-wise / Geographical' Excel files for Tier-2/Tier-3 specific volumes). Link: https://www.amfiindia.com/research-information/mutual-fund-data
8. ₹300 Trillion Projection Context: Based on broader industry consensus regarding India's financialisation, aligned with baseline GDP growth estimates tracked by the International Monetary Fund (IMF) - India Datasets and major equity strategy reports mapping the multi-decade wealth shift. Link: https://www.imf.org/en/Countries/IND
Mutual Fund Investments are subject to market risks, read all scheme related documents carefully.
Calculator
View All


